
Today we will see how to add different types of charts in LightningWebComponents using third party JS library.
As of Today we don't have any out of the box/base components provided by salesforce to display the charts.So we are using third party libraries.
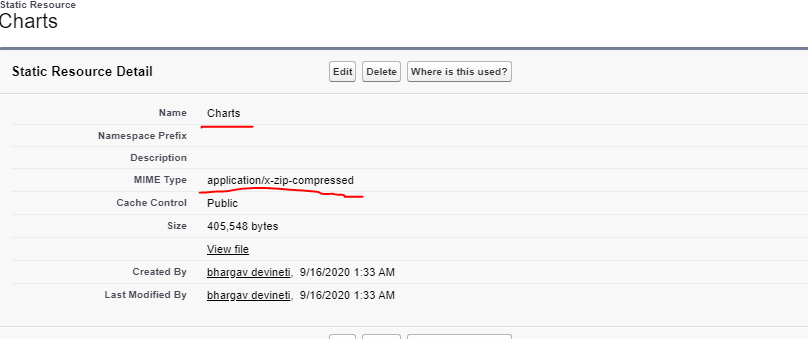
- First we need to download Chart.js zip folder and import the zip folder to Static Resource as shown below.
- Create a new LWC and in js file of your LWC we need to import below two statements.
import chartResource from '@salesforce/resourceUrl/Charts';
import { loadScript } from 'lightning/platformResourceLoader';
->First statement is to import the static resource we uploaded and loadScript is used to load the javascript file.

chartExample.html
- We need to use lwc:demo="manual" directive here.To add child elements under this we need to use this directive.
- We are displaying "bar" and "radar" chart using this component.
chartExample.js
- loadChartResource() method is calling from the connectedCallback() method.In loadCharResource() method Charts will get loaded.
- In callBarChart() and callRadarChart() methods need to specify the type of chart and the data to show in the chart.
- Change the type to "pie" to show Pie Chart and data remains the same format.
- After forming the data insert the chart to html element using "canvas" created in insertToDOM()method.
- Supported types of charts are: line,pie,radar,bar,bubble,scatter,polar area and doughnut.
You can create Radar chart in Excel and Google Sheets without any coding skills.
ReplyDeleteChartExpo™ is both an Excel and Google Sheets data visualization tool to create 50+ custom charts from few clicks.
Try it for Free:
ChartExpo™ for Excel
ChartExpo™ for Google Sheets
Sharing a video to watch how easy to create charts in Google Sheets and Excel.
How to create Sankey Chart?
Thanks.